What it is
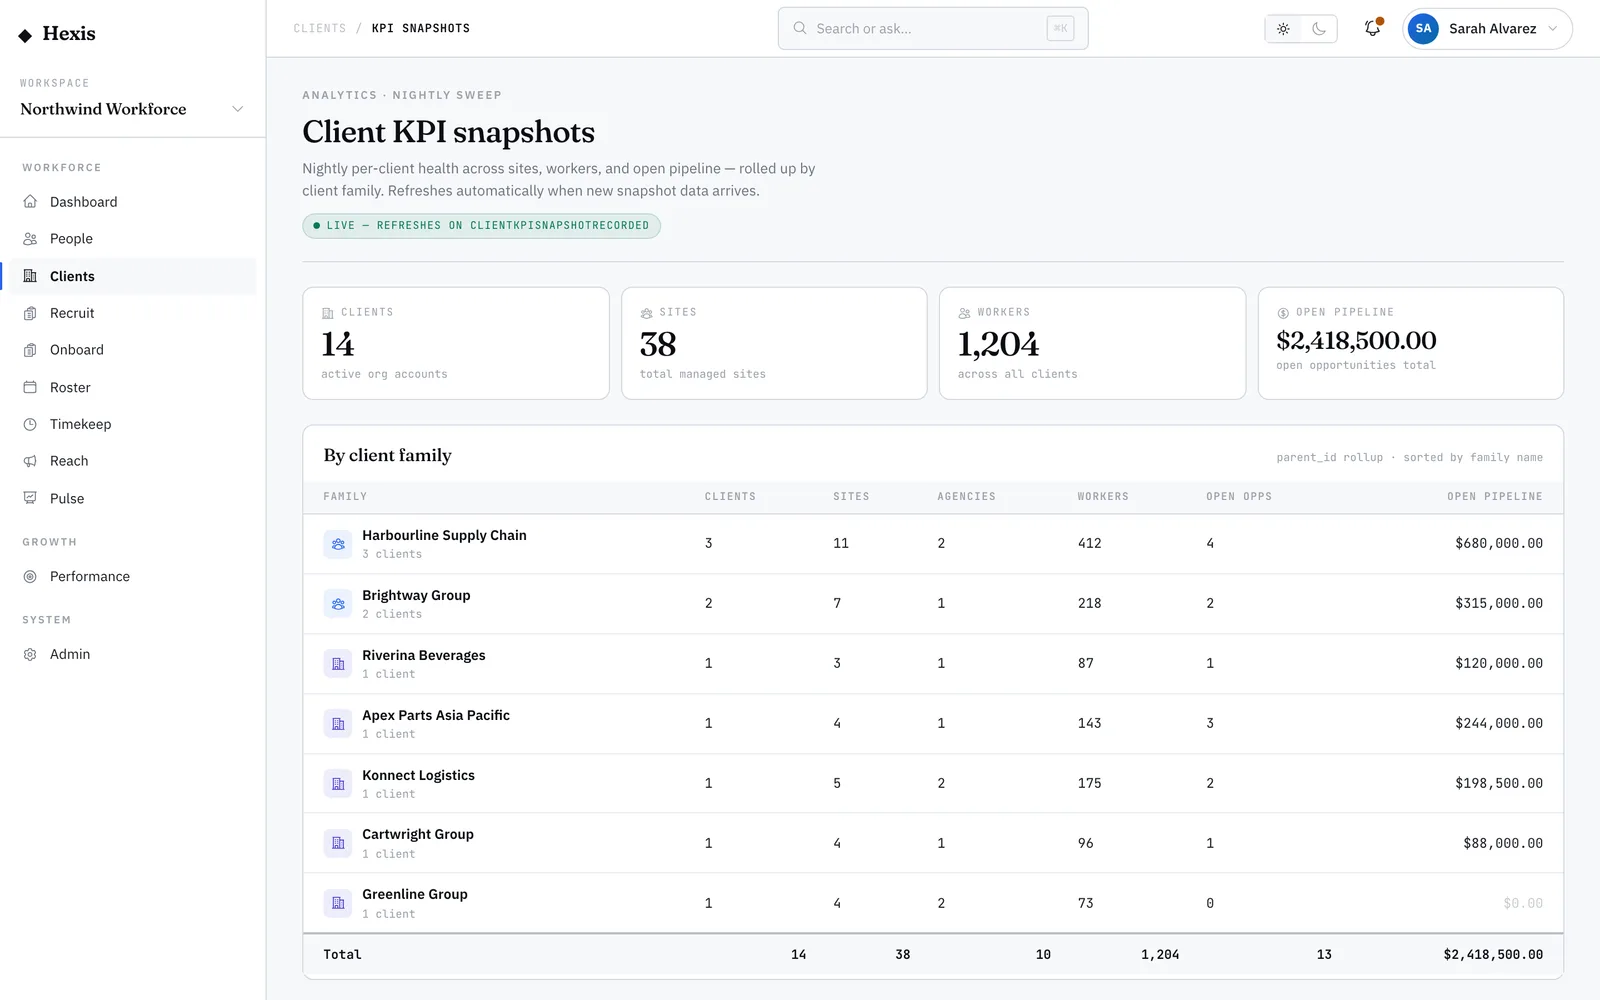
The client KPI dashboard is the analytics home for the health of your whole client book. It is refreshed every night, so each morning you open it to a current picture: how many clients you serve, how many sites and workers sit beneath them, and how much open pipeline you are carrying. It also groups child entities under their parent so a multi-entity client reads as one family.
Use it to spot drift early. A client whose worker count is falling, a group whose pipeline has dried up, or a new entity that hasn’t been staffed yet all show here before they become a conversation. From the board you can drill into any single client to see its trend over time.
When to use it
- You want a morning read on the health of the whole client book
- You are preparing for an account review and need current numbers
- A client belongs to a group and you want the family totals, not just one entity
- You suspect a client is shrinking and want to confirm the trend
- You need the org-wide totals for sites, workers or open pipeline
How it works
Step by step.
- 1
Open the KPI board
Go to the client KPI dashboard. The top tiles give you the org totals: clients, sites, workers and open pipeline value.
- 2
Scan the family rollup
The rollup table groups child clients under their parent, so a multi-entity client reads as a single family with combined totals.
- 3
Spot the outliers
Look for clients whose numbers stand out — unusually low worker counts, no open pipeline, or a new entity yet to be staffed.
- 4
Drill into a client
Click a client row to open its KPI trend, where up to sixty nightly snapshots show how its sites, workers and pipeline have moved.
- 5
Read the trend tiles
On the client trend, the headline tiles show the latest snapshot and the history table shows the movement night by night.
Worked example
Follow it through.
The scenario
It is Monday morning and you want to check the Meridian Retail group before a quarterly review.
- 1 Open the client KPI dashboard and read the org tiles.
- 2 Find Meridian Retail in the family rollup; the parent shows its child entities combined.
- 3 Notice the child entity Meridian Retail North has dropped from 40 to 31 workers.
- 4 Click into Meridian Retail North to see its KPI trend.
- 5 The history table shows the decline started two weeks ago.
The result
You arrive at the review knowing the group totals and the exact entity and timing behind a nine-worker drop.
Tips & notes
Good to know.
- The board is refreshed overnight, so the numbers are as at this morning — there is nothing to recalculate.
- Read the family rollup before single entities; a group can look healthy overall while one entity slides.
- The client trend holds up to sixty nights of history — enough to tell a real trend from a quiet week.
- Open pipeline on this board is your forward read; pair it with the CRM pipeline for the deal-by-deal detail.
When you’re done
A current, org-wide read on client health, with a clear path from the whole book down to one client’s trend.