What it is
The pipeline is your sales board, laid out as stages from qualification through discovery, proposal and negotiation, with a closed column for won and lost. Each card is an opportunity — a named piece of potential work on an account, with its value, probability and expected close date. Each column header sums the count and value sitting in that stage, so the shape of your pipeline is visible at a glance.
You work the board by moving cards forward as deals progress, and you keep the value and close dates honest so the forecast means something. A pipeline with everything stuck in one stage, or with stale close dates, is the first sign a forecast is drifting from reality.
When to use it
- A deal has progressed and its card should move to the next stage
- You want to see total value sitting at proposal or negotiation
- You are preparing a forecast and need current close dates
- A deal has closed — won or lost — and should leave the open stages
- You want to spot opportunities that have gone stale
How it works
Step by step.
- 1
Open the pipeline board
Go to the pipeline to see your opportunities laid out by stage, with count and value summed per column.
- 2
Read the shape
Scan the column totals to see where value sits and whether deals are bunching in one stage.
- 3
Open an opportunity
Click a card to see its account, value, probability, expected close date and owner, and to update any of them.
- 4
Move the card forward
Advance the opportunity to the next stage as the deal progresses, or to closed-won or closed-lost when it resolves.
- 5
Keep value and dates current
Update the amount and expected close date so the column totals and your forecast stay trustworthy.
Worked example
Follow it through.
The scenario
A warehouse-staffing deal with Coastline Logistics has just reached contract talks.
- 1 Open the pipeline and find the Coastline Logistics warehouse opportunity in the proposal column.
- 2 Open the card; it shows 120,000 AUD at 60 percent, closing 27 Jun.
- 3 Update the probability to 80 percent now that terms are agreed.
- 4 Drag the card from proposal to negotiation.
- 5 Confirm the negotiation column total rises by 120,000 AUD.
The result
The opportunity sits in negotiation at 80 percent, and the column totals reflect the moved value, keeping the forecast current.
Tips & notes
Good to know.
- Trust the column totals only as far as you trust the close dates — set a calendar habit to clear stale ones.
- Probability and value together drive the weighted forecast; nudge probability as risk changes, not just at stage moves.
- Closed-won and closed-lost both teach you something; record the reason so win-loss patterns surface.
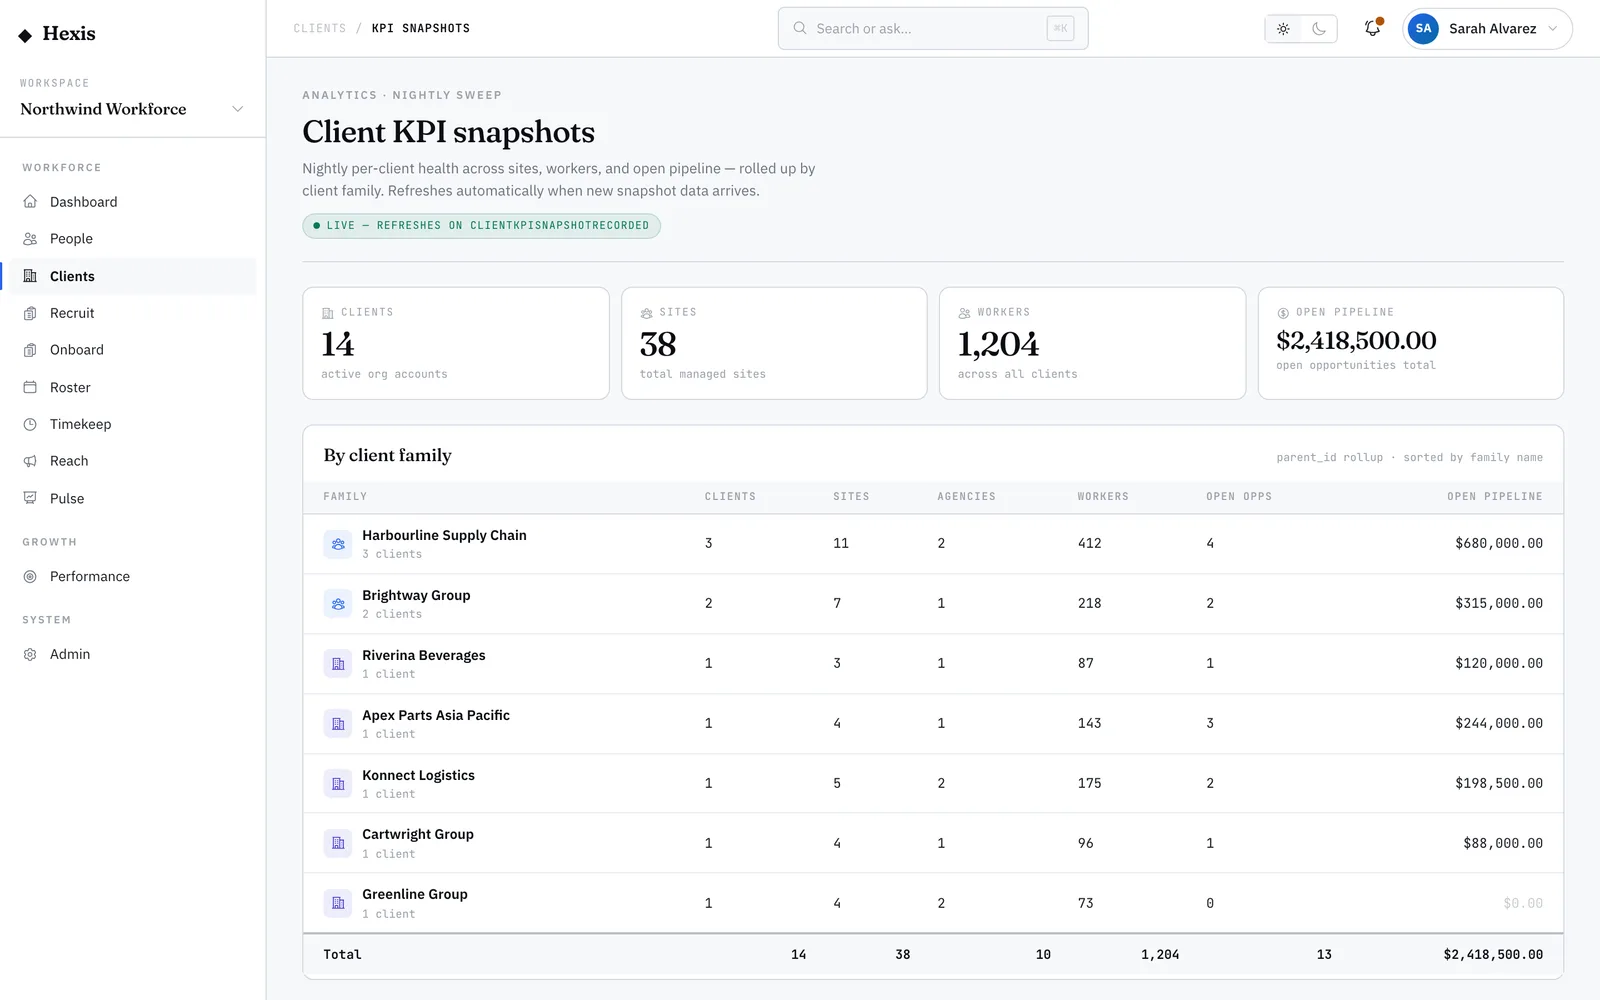
- Open pipeline value here ties back to the open-pipeline tile on the client KPI dashboard.
When you’re done
A current, honest pipeline where each stage’s count and value reflect where your deals really stand.