What it is
Learning reports turn all the course, enrolment and certification activity into numbers you can act on and share. Completion rates, who’s overdue, credential coverage by role, training delivered over time — pulled together, filtered to the slice you care about, and ready to export.
It matters because what gets measured gets managed, and clients increasingly ask to see it. A board wants the compliance percentage, a client wants proof their site is trained, a workforce lead wants to know where the training money is working. Reports answer those without anyone building a spreadsheet by hand.
When to use it
- You need a completion rate for a course, team or whole workforce
- A client wants evidence their site’s workers are trained
- You’re reporting compliance coverage to leadership
- You want to see training trends over a period, not a single snapshot
- You need to export figures for an audit or a client report
How it works
Step by step.
- 1
Open reports
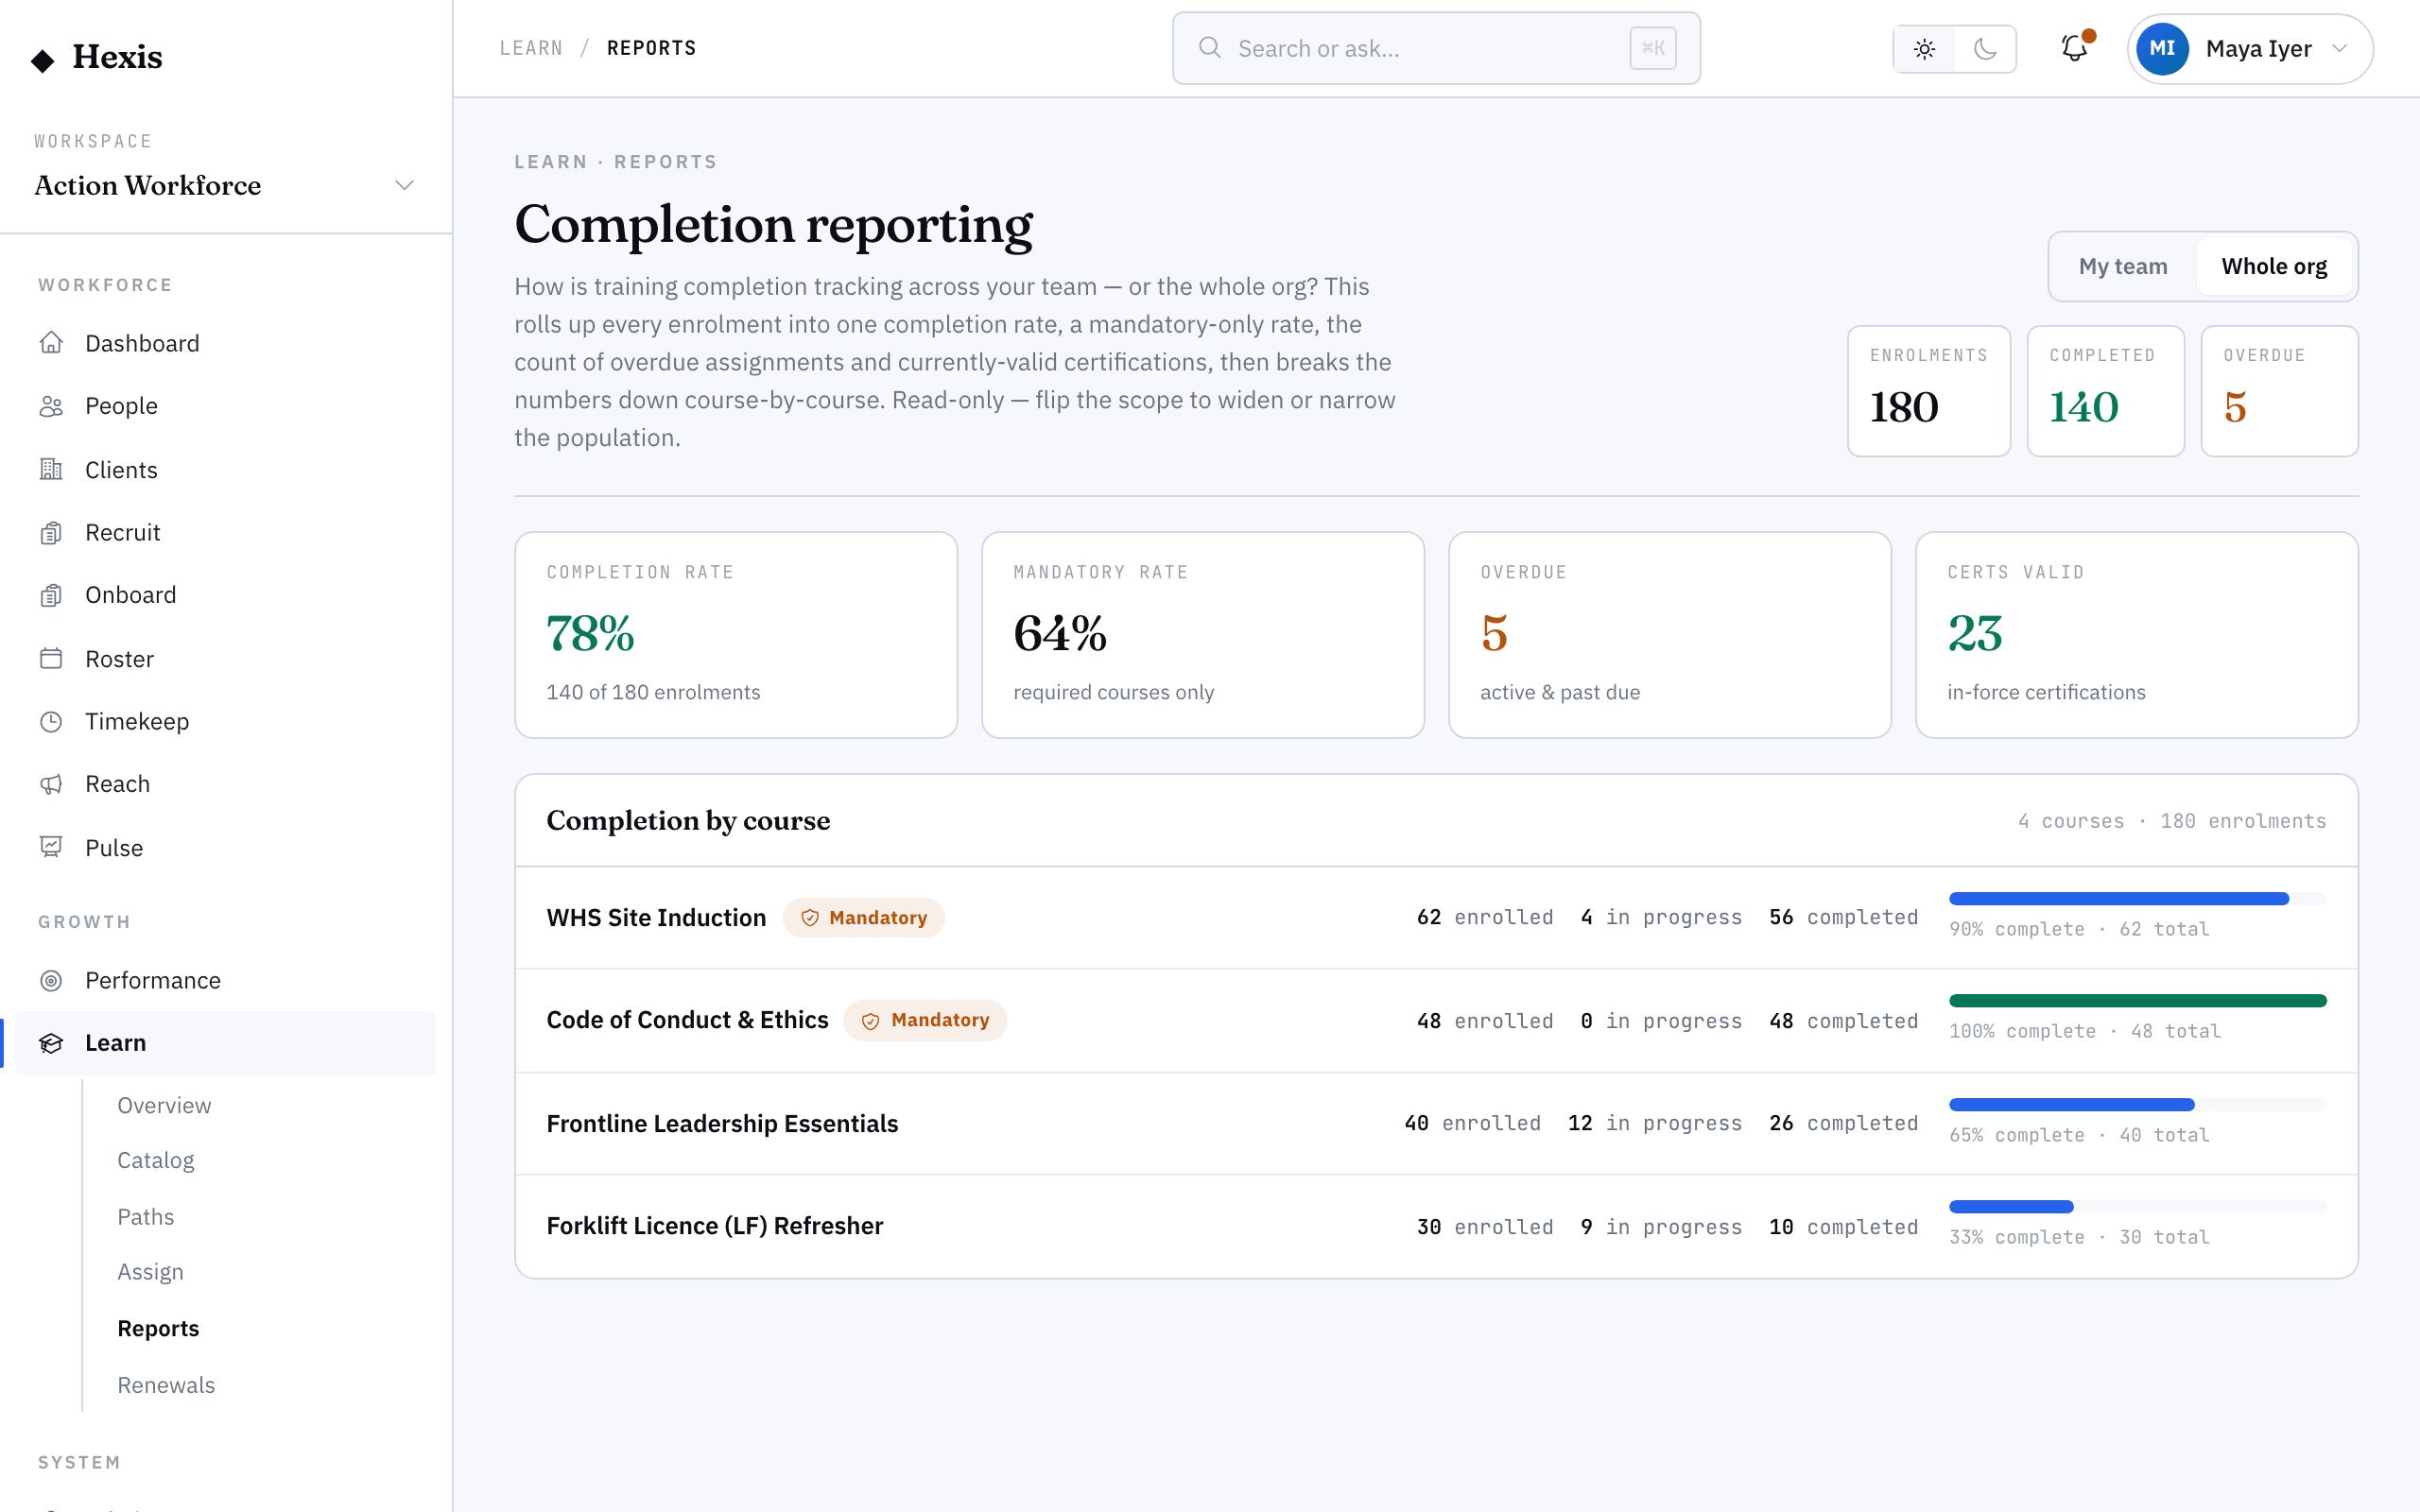
Open the learning reports area. You’ll see headline figures — completion, compliance, credential coverage — across the workforce.
- 2
Filter to your slice
Narrow by course, team, client site or date range so the numbers reflect exactly the question you’re answering.
- 3
Read the breakdown
Drill into a figure to see who’s behind it — which workers are complete, in progress or overdue for the selected scope.
- 4
Compare over time
Switch to a date range to see whether completion and compliance are trending up, so you can show progress, not just a snapshot.
- 5
Export the result
Export the filtered report to share with a client, attach to an audit, or take into a leadership review.
Worked example
Follow it through.
The scenario
Coastline Logistics asks Northwind for proof that everyone working its Harbour Point Terminal completed the new site induction.
- 1 A workforce lead opens reports and filters to the Coastline Logistics Site Induction course.
- 2 They narrow the scope to workers assigned to Harbour Point Terminal — 22 people.
- 3 The completion figure reads 21 of 22 complete; one in progress, none overdue.
- 4 They drill in to confirm the single in-progress worker, Liam Brennan, is due to finish this week.
- 5 They export the filtered report to send to the client.
The result
The lead has a clean, exportable record showing 21 of 22 inducted and the last on track — exactly the proof Coastline Logistics asked for.
Tips & notes
Good to know.
- Filter before you read — an unfiltered figure across the whole workforce rarely answers the specific question you have.
- The date-range view is what turns a report into a story: it shows you’re improving, not just where you stand today.
- Export early and keep the file with your audit pack, so client and compliance evidence is ready before it’s requested.
- A completion rate pairs well with the competency matrix — the report gives the number, the matrix shows exactly which cells to fix.
When you’re done
You have the training and compliance numbers you need, filtered to your scope and ready to export.