What it is
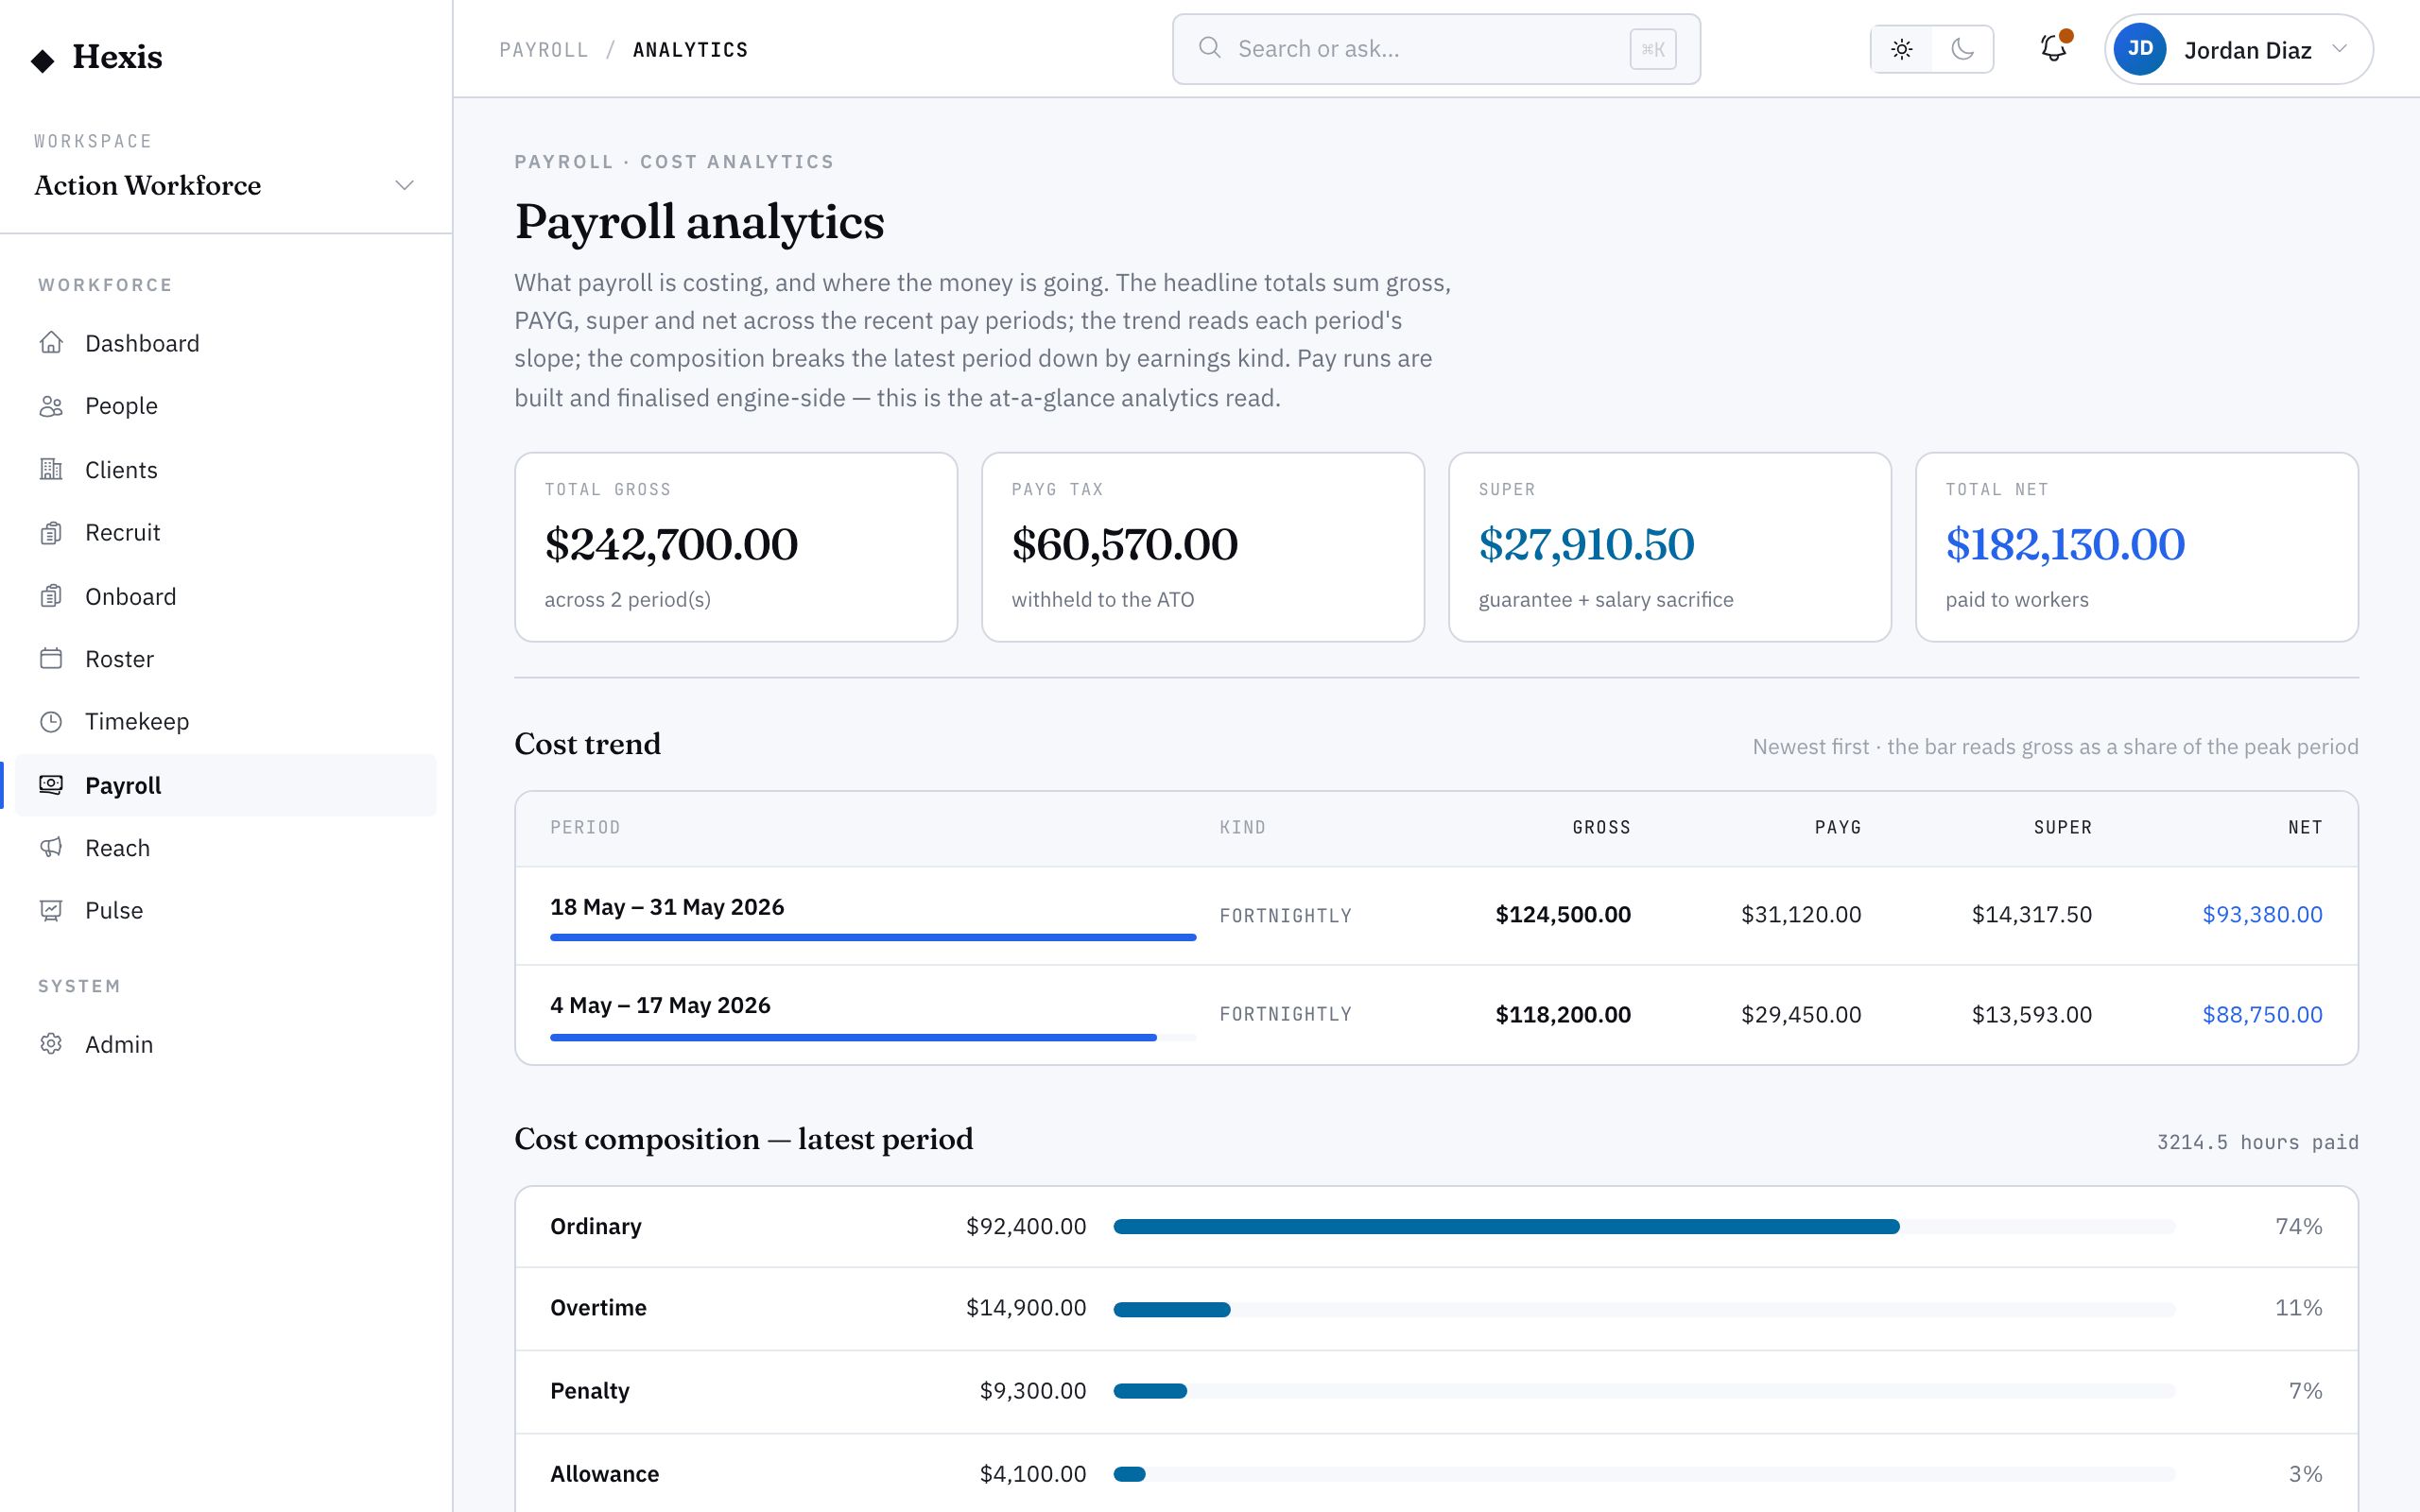
Payroll analytics answers two questions finance asks every month: what is payroll costing, and where is the money going? It sums gross, PAYG, super and net across the recent finalised periods for the headline totals, shows a period-by-period cost trend so you can read the slope, and breaks the latest period down so you can see which part of the workforce drove the cost.
This is the read for managing the bottom line, not running pay. Use it to brief leadership, to catch a cost creeping up before it surprises anyone, and to understand the make-up of a period — overtime, penalties and allowances against ordinary time — so the conversation is about a cause, not just a number.
When to use it
- You’re briefing leadership on payroll cost for the period
- You want to see whether cost is trending up or down
- A period came in higher than expected and you need to know why
- You’re comparing the cost make-up of recent periods
How it works
Step by step.
- 1
Open analytics
It opens on the headline totals — gross, PAYG, super and net summed across the recent finalised periods.
- 2
Read the headline totals
These are the top-line numbers for the recent cohort of periods, the figures you’d put in front of finance.
- 3
Follow the cost trend
See each period in turn — its label, kind and the four totals — with an inline bar to read the slope across periods.
- 4
Open the composition
For the latest period, see the labour cost grouped so you can tell ordinary time apart from overtime, penalties and allowances.
- 5
Explain the movement
Use the trend and composition together to explain why a period moved — more overtime, a new site, a rate change.
Worked example
Follow it through.
The scenario
Finance asks Northwind Workforce’s ops lead why payroll cost rose this month.
- 1 Open analytics; the headline totals show gross up about 8% on the prior cohort.
- 2 The cost trend shows the rise concentrated in the last two fortnights.
- 3 The latest period’s composition shows overtime and Saturday penalties up sharply.
- 4 You trace it to the new Coastline Logistics weekend contract at Harbour Point Terminal.
- 5 You brief finance that the rise is the new weekend contract, not a rate error.
The result
A clear, evidenced explanation that the cost rise came from a new weekend contract’s overtime and penalties, not an error.
Tips & notes
Good to know.
- Read the trend and the composition together — the trend tells you a period moved, the composition tells you why.
- A jump in penalties or overtime usually points at a roster or contract change, not a pay-rate problem.
- Analytics covers finalised periods only, so the latest open run won’t show until it finalises.
- For a forward-looking cost rather than a backward read, use the cost forecast to model the next period.
When you’re done
A clear picture of payroll cost and its make-up across recent periods, ready to brief and to act on.